Field of Science

Games with a purpose

I like to believe we are running some of the more innovative experiments on the Web. Occasionally, however, I run across true masters of the form.

One of my current favorites is Games With a Purpose. The avowed purpose of the site is to "make computers smarter." From what I can tell, they are mainly focusing on labeling. As I have written before, we often think that children learn words like "dog" by seeing a dog while their mother or some other adult says "dog." It turns out that this kind of learning is actually very, very difficult. In fact, it has been shown that a very smart baby who used impeccable logic -- that is, a baby who was like a well-programmed computer -- would in fact never learn any words at all. We must have some innate biases that allow us to learn words.

This brings us to the issue of GoogleImage. Google would like to help us find pictures on the web. But we search by typing in a phrase. To make this work, then, Google needs to figure out what words would best describe any given picture. As I just mentioned above, this is something humans do well but at which computers are hopeless.

This, I assume, explains the existence of Google Image Labeler, a game previously created by the same folks behind Games with a Purpose. This is a game based around labeling images. Games with a Purpose has a similar game in which you label music.

Unfortunately, neither Google nor GWAP.com have much information that I can find about how exactly this information is used. One obvious possibility is that the labels they derive from the players go directly into the Google database. Another possibility is that the researchers are using the information derived in these games to create data sets with which they can train computers using learning algorithms.

So what do I think is cool about this stuff? It's an application of very simple Web technology to do something that is difficult or impossible to do without the Internet.

It should hopefully be clear that the problems being solved here require massive amounts of labor. Labeling all the images on the Internet is way beyond the capabilities of even the most dedicated engineer. However, if everybody in the world labeled a handful, that would be tens or hundreds of billions of labels. Similarly, even if one is not trying to label all the images on the web and only trying to provide training data for a computer model, such models require massive data sets.

The best spam filter ever

The famous Turing Test tests the intelligence of computers in the following way: if a computer can convince us it is a human, it is probably as intelligent as a human (that's not Turing's original version, but it's better known).

What is interesting is that although Turing focused on language and problem solving, one of the easiest ways of telling a human from a machine is our perceptual system -- especially our sense of vision, which in humans is the dominant of the five senses. So one of the most important forms of the Turing Test today is actually a vision test.

To get an account on just about any website, you must prove you are human by copying a few sloppily-written letters. Machines, despite decades of research, are very bad at visual recognition of objects, including alphanumeric letters. These bits of text that you have to rewrite are called CAPTCHAs.

Bring to the scene reCAPTCHA. The website says it all:

About 60 million CAPTCHAs are solved by humans around the world every day. In each case, roughly ten seconds of human time are being spent. Individually, that's not a lot of time, but in aggregate these little puzzles consume more than 150,000 hours of work each day. What if we could make positive use of this human effort? reCAPTCHA does exactly that by channeling the effort spent solving CAPTCHAs online into "reading" books.


That is, each CAPTCHA is in fact a section of text in a book that is being digitized that their computer is unable to read. I have no idea how well the system has worked so far or the details of the implementation, but the idea is brilliant, and really captures part of what makes the Web so powerful: millions of people all donating just a few minutes of their time. This is of course what has given us the Fray, Wikipedia, and Web-based experiments. But unlike those cases, filling out CAPTCHAs is something people have to do anyway.

Reading between the lines (even when you don't know you are doing it)

I have been writing for a few days about risk-seeking and risk-averse behavior. In particular, I described the famous Asian Flu problem. For those who haven't read about it yet or don't remember it, here it is again:

Version 1
A new strain of flu is expected to kill 600 people. Two programs to combat the disease have been proposed. If program A is adopted, 200 people will be saved. If program B is adopted, there is a one-third probability that 600 people will be saved and a two-thirds probability that no people will be saved. Which of the two programs would you favor?

Version 2
A new strain of flu is expected to kill 600 people. Two programs to combat the disease have been proposed. If program A is adopted, 400 people will die. If program B is adopted, there is a one-third probability that nobody will die and a two-thirds probability that 600 people will die. Which of the two programs would you favor?

The important result is that even though the two questions are exactly the same, when given Version 1, people prefer program A. When given Version 2, people prefer program B. 

At least, that is the story usually given. Steven Pinker has made a very convincing argument that the two versions are not the same:

The description "200 people will be saved" refers to those who survive because of the causal effects of the treatment. it is consistent with the possibility that additional people will survive for different and unforeseen reasons--perhaps the flu may be less virulent than predicted, perhaps doctors will think up alternative remedies, and so on. So it implies that at least 200 people will survive. The scenario "400 people will die," on the other hand, lumps together all the deaths regardless of their cause. it implies that no more than 200 people will survive. (Stuff of Thought, p. 260)

It is difficult to tell from the text whether Pinker is suggesting an explanation for why people are risk-averse for gains but risk-seeking for losses, or whether he is just noting a contributor factor to this particular experiment. Risk-aversion has been so well studied over the last several decades I seriously doubt that every demonstration is susceptible to this criticism. 

The reason that I think this is a really important point is that it illustrates how the strict logical meaning of a sentence is not always what the sentence "means." That is, we often read between the lines without even noticing it. Here, these two versions of the Asian Flu problem, strictly speaking and according to logic, are identical. That doesn't mean that they are necessarily interpreted identically.


Tversky, A., Kahneman, D. (1981). The framing of decisions and the psychology of choice. Science, 211, 453-458.

Avoiding risk

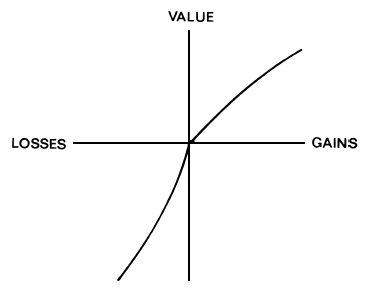
One of the most famous figures in psychology is the following:


This is the famous utility curve that helped Daniel Kahneman win the Nobel Prize. To understand just what a big deal this is, psychologists very rarely win the Nobel Prize because there is no Nobel Prize for psychology (he won for economics).

Here's how to understand the figure. On the X axis is objective gains and losses (for sake of simplicity, assume what we are gaining and losing is money). On the Y axis is subjective utility -- how much you like the gain or dislike the loss.

The striking thing is that the line is not straight. The idea is that the difference between winning $5 and winning $15 is greater than the difference between winning $1005 and $1015. The same goes for losses -- losing $5 is annoying, but losing an extra $5 on top of a loss of $1000 is just a drop in the bucket. This explains, among things, why people will spend an extra $5 on a car or a house but not on a stick of gum (a strange finding, when you think about it, since $5 is $5 either way).

These curves also predict something very interesting. Suppose you had a 50% chance of winning $10 and a 50% chance of winning nothing or you could take a guaranteed $5. Which would you do? Most people go with the guaranteed bet. This makes no sense according to probability theory, since your expected win is $5 either way, but it does when you look at the graph. The average subjective value of $10 and $0 is actually less than the subjective value of $5. Thus the best bet in terms of subjective value is the sure-thing $5.

With losses, you see something different. Suppose you had a 50% chance of losing $10 and a 50% chance of losing $0 or a guaranteed loss of $5. Most people would take their chances on the coin flip rather than going with the guaranteed loss. This again makes no sense if you look at the monetary values -- it's $5 on average either way. However, the average subjective pain of losing $10 and losing nothing is actually less than the subjective pain of losing $5. So the best bet in terms of the subjective value of the losses is to go with the coin flip.

This graph also shows that losses loom larger than gains, but I leave it to the reader to work this out for themselves. Altogether, these few squiggles pack in a lot of information.

Illegal Philosophy

One of the most famous thought problems from the philosophy of language in the latter half of the 20th century turns out to have legal ramifications. To illustrate that what is meant is not always the same thing as what is said, H. Paul Grice created a hypothetical letter of recommendation for a would-be professor of philosophy. There are many variants of this letter around these days (it's a popular example). Here is one:

To whom it may concern:

Jones dresses well and writes grammatical English.

Sincerely,
Professor So-and-so

That is what is said. What is meant is clearly that Jones is no good at philosophy. Explaining in a rigorous fashion how we come to that conclusion has occupied a number of researchers for half a century and no doubt will continue to do so for some time. This is despite the fact that such letters appear to be illegal in California (the state in which Grice worked).

In a footnote to a recent book chapter, the linguist Laurence Horn cites a court case (Randi M. v. Livingston Union School District, 1995 Cal. App. LEXIS 1230 (Dec. 15, 1995)), in which it was found that "a statement that contains only favorable matters and omits all reference to unfavorable matters is as much a false representation as if all the facts stated were untrue."

The moral of this story may be that philosophy is great, but check with a lawyer before trying to apply it to the real world. 

Why are humans risk averse?

After my first foray into computational simulations successfully predicted that losses should loom larger than gains, at least when the stakes are high, I decided to take on an even more complicated phenomenon in psychology and economics: risk aversion.

Daniel Kahneman, one of the few psychologists to win a Nobel Prize -- largely because there is no Nobel Prize for psychology -- along with Amos Tversky achieved at least some of his fame by demonstrating that humans are risk-averse for gains but risk-seeking for losses.

The most famous demonstration of this came from the following experiment (known as the "Asian Flu problem"):

The Center for Disease Control discovers there is an outbreak of Asian Flu in the United States. If nothing is done, they predict that 600 people will die. Two courses of action have been suggested. If program A is adopted, 200 people will be saved. If program B is adopted, there is a one-third probability that 600 people will be saved and a two-thirds probability that no people will be saved. Which of the two programs do you favor?

Most people, it turns out, pick program A, the sure bet. This is interesting, because, on average, the two programs are exactly the same. That is, on average, program B will save 200 people, just like program A. The difference is that program B is more risky.

This would seem to demonstrate that people are risk-averse. However, you can reword the problem just slightly and get a very different response:

Two courses of action have been suggested. If program A is adopted, 400 will die. If program B is adopted, there is a one-third probability that nobody will die and a two-thirds probability that 600 people will die. Which of the two programs do you favor?

Given this scenario, most people pick program B. However, notice that this is the exact same program as in the first version of the problem! It turns out that if people think about the issue in terms of lives saved, they are risk-averse. If they think about the issue in terms of lives lost, they are risk-seeking (they choose the riskier option).

There is no right or wrong answer according to logic, because logic and statistics tell us that program A and B are essentially identical.

In my last simulation, I suggested that it actually makes sense for losses to loom larger than gains, even though statistics and logic don't predict this. Maybe the same is true for being risk averse for gains and risk-seeking for losses. Maybe that is actually adaptive.

Here's how my simulation worked: Each of my simulated "creatures" played the following game: They could either take a sure gain of 10 units of food, or they could take a risky gain: a 50% chance of 5 units or a 50% chance of 15 units. Again, the two choices are statistically identical -- on average, you get 10 units of food either way. Some of the creatures were risk-averse and always took the sure bet; some were risk-seeking and always took the risky bet.

The creatures also played the same game for losses: they either had a guaranteed loss of 10 units or a 50% chance of losing 5 and a 50% chance of losing 15. Again, some were risk-seeking and some were risk averse.

Each creature played both games (the gain game and the loss game) 1000 times. There were 1000 creatures who were, like humans, risk-averse for gains and risk-seeking for losses. There were 1000 creatures who were risk-seeking for gains and risk-averse for losses (the opposite of humans). There were also 1000 creatures who were risk-seeking for both gains and losses.

The creatures all started with 100 pieces of food.

Risk-averse for gains/Risk-seeking for losses:
52% died
98 = average units of food at end of simulation

Risk-seeking for gains/Risk-averse for losses:
54% died
92 = average units of food left at end of simulation

Risk-seeking for gains & losses:
68% died
94 = average units of food left at end of simulation


While this simulation suggested that being risk-seeking across the board is not a good thing, it did not suggest that being risk-seeking for gains and risk-averse for losses was any better than the other way around. This could be because the size of the gains and losses was too large or two small relative to the starting endowment of food. I tried both larger endowments of food (200 units) and smaller (50 units), but the pattern of results was the same.

Again, this was a very simple simulation, so it is possible that it does not include the crucial factors that make the human strategy an adaptive one. It is also possible that the human strategy is not adaptive. Hopefully I will come across some papers in the near future that report better simulations that will shed some light onto this subject.


-----
(Note that as far as I can tell, being risk-seeking for losses should prevent people from buying insurance, yet people do. I'm not sure why this is, or how Kahneman's theory explains this.)


Tversky, A., Kahneman, D. (1981). The framing of decisions and the psychology of choice. Science, 211, 453-458.

Another reason everyone should learn statistics

Here is another insightful experiment from Tversky and Kahneman:

In a discussion of flight training, experienced instructors noted that praise for an exceptionally smooth landing is typically followed by a poorer landing on the next try, while harsh criticism after a rough landing is usually followed by an improvement on the next try. The instructors concluded that verbal rewards are detrimental to learning, while verbal punishments are beneficial.

It's not clear from the description whether the instructors considered whether their lesson plan would be beneficial to morale, but in any case, they were almost certainly wrong. They fell for a statistical phenomenon known as "regression to the mean."

Basically, every time you measure something, there is some error. For instance, although Sally may be a B student, sometimes she gets As on her tests and sometimes she gets Cs. Some days she has good days and some days she has bad days.

Now suppose you give a test to the whole class and then select all the students who got As to be in a special program. That group of students who got As will include some who are normally A students, but it will also include some people who normally are B or C students but who had a good day. So, if you were to re-test those same students, the average grade would decline, perhaps to an A- or B+. This isn't because the students got stupider; it's just that the students who got fluke As the first time are unlikely to repeat their performance.

Similarly, if you had picked all the students who failed the exam, that group of students would have included both true F students as well as a few C or D students (maybe even B or A students) who were having a rough day. If you retest them, the average grade will move up, because those C and D students will likely do better the second time. They haven't gotten smarter; it's just regression to the mean.

Those flight students would probably have had a better experience if their instructors knew about regression to the mean.


----
Some readers might have wondered the following: if, in the group of students who got As, some of their scores will go down upon re-testing, shouldn't some go up? Yes and no. Some scores would go up, but those are mostly typically A students who got Bs or Cs on that particular exam. However, you have already excluded them from the group, so their rebounding scores can't off-set the falling scores of the typically B and C students.


Tversky, A., Kahneman, D. (1974). Judgment under uncertainty: heuristics and biases. Science, 185(4157), 1124-1131.

Why admissions interviews should be abandoned

An important part of the admission process to a competitive college is the admissions interview. I'm against it. And that isn't just because interviews were originally instituted to keep Jews out of Harvard. It's because they are poor predictors of future performance and, even worse, they are poor predictors that people weight very heavily.

I was first clued into this by none other than Google. Google recently revamped the way it chooses new hires, and an important part of the overhaul was minimizing the importance of the interview. As Laszlo Bock, Google's vice president for people operations said, "Interviews are a terrible predictor of performance."

This stands to reason. We all know people who make great first impressions but then turn out to be lousy employees/students/friends/etc. Similarly, we know people who originally struck us as dull but turned out to be our best employee/student/friend/etc. However, it would be nice to have something quantitative to back up this observation, and so I've been on the lookout ever sense.

It is in this context that I read this following quote from a classic Science paper by Tversky and Kahneman:

It is a common observation that psychologists who conduct selection interviews often experience considerable confidence in their predictions, even when they know of the vast literature that shows selection interviews to be highly fallible. The continued reliance on the clinical interview for selection, despite repeated demonstrations of its inadequacy, amply attests to the strength of this effect.

Tversky and Kahneman probably did not think this was a problem with the clinical interview per se. They give several other examples, including a study in which participants read a short description of a particular lesson a student teacher gave. Some participants were asked to evaluate the quality of the lesson, giving it a percentile score. Others were asked to guess the percentile score of that student teacher's overall abilities 5 years in the future. The judgments in both conditions were identical. That is, the participants believed that the quality of a single lesson fully predicted how good a future teacher would be. They don't take into consideration that the student teacher might be having a bad or good day.

Tversky and Kahneman have an explanation for why people care so much about interviews. Across the board, people believe that small samples are much more reliable than they are. I recommend the original paper if you want the full argument, but they bring up many examples. For instance, participants believe a random sample of 10 men is just as likely to have an average height of 6 feet as a random sample of 1000. This is not mathematically possible, but even experts in statistics can, under the right circumstances, fall for this.

This is why I think the admissions interview, as well as the job interview, should be scrapped. It takes place over a short period of time, which means it is an inherently unreliable predictor of future performance. It's unreliable, but, even knowing that, the information gleaned from it irresistible.


Tversky, A., Kahneman, D. (1974). Judgment under uncertainty: heuristics and biases. Science, 185(4157), 1124-1131.

Why is losing $10 worse than winning $10 is good?

Losses loom larger than gains.

This useful mnemonic describes an odd experimental finding: if you have people rate on a scale of 1 to 10 how unhappy they would be to lose $100, that rating will be higher than if you ask them how happy they would be to win $100. Similarly, people tend to be reluctant to gamble when the odds are even (50% chance of winning $100, 50% chance of losing $100). Generally, if odds are even, people aren't likely to bet unless the potential prize is greater than the potential loss.

This is a well-known phenomenon in psychology and economics. It is particularly surprising, because simple statistical analysis would suggest that losses and gains should be treated equally. That is, if you have a 50% chance of winning $100 and a 50% chance of losing $100, on average you will break even. So why not gamble?

(Yes, it is true that people play slot machines or buy lottery tickets, in which, on average, you lose money. That's a different phenomenon that I don't completely understand. When/if I do, I'll write about it.)

A question that came up recently in a conversation is: why aren't people more rational? Why don't they just go with the statistics?

I imagine there have been papers written on the subject, and I'd love to get some comments referring me to them. Unfortunately, nobody involved in this conversation knew of said papers, so I actually did some quick-and-dirty simulations to investigate this problem.

Here is how the simulation works: each "creature" in my simulation is going to play a series of games in which they have a 50% chance of winning food and a 50% chance of losing food. If they run out of food, they die. The size of the gain and the size of the loss are each chosen randomly. If the ratio of gain to loss is large enough, the creature will play.

For some of the creatures, losses loom larger than gains. That is, they won't play unless the gain is more than 1.5 times larger than the loss (50% chance of winning 15.1 units of food, 50% chance of losing 10). Some of the creatures treat gains and losses roughly equally, meaning they will play as long as the gain is at least a sliver larger than the loss (50% chance of winning 10.1 units of food, 50% chance of losing 10). Some of the creatures weigh gains higher than losses and will accept any gamble as long as the gain is at least half the size of the loss (50% chance of winning 5.1 unites of food, 50% chance of losing 10).

(Careful observers will note that all these creatures are biased in favor of gains. That is, there is always some bet that is so bad the creature won't take it. There are never any bets so good that the creature refuses. They just differ in how biased they are.)

Each creature plays the game 1000 times, and there are 1000 creatures. They all start with 100 units of food.

In the first simulation, the losses and gains were capped at 10 units of food, or 10% of the creature's starting endowment, with an average of 5 units. Here's how the creatures faired:

Losses loom larger than gains:
0% died.
807 = average amount of food at end of simulation.

Losses roughly equal to gains:
0% died.
926 = average amount of food at end of simulation.

Gains loom larger than losses:
2% died.
707 = average amount of food at end of simulation.


So this actually suggests that the best strategy in this scenario would be to treat losses and gains similarly (that is, act like a statistician -- something humans don't do). However, the average loss and gain was only 5 units of food (5% of the starting endowment), and the maximum was 10 units of food. So none of these gambles were particularly risky, and maybe that has something to do with it. So I ran a second simulation with losses and gains capped at 25 units of food, or 25% of the starting endowment:

Losses loom larger than gains:
0% died
1920 = average amount of food at end of simulation

Losses roughly equal to gains:
1% died
2171 = average amount of food at end of simulation

Gains loom larger than losses:
14% died
1459 = average amount of food at end of simulation


Now, we see that the statistician's approach still leads to more food on average, but there is some chance of starving to death, making weighing losses greater than gains seem like the safest option. You might not get as rich, but you won't die, either.

This is even more apparent if you up the potential losses and gains to a maximum of 50 units of food each (50% of the starting endowment), and an average of 25 units:

Losses loom larger than gains:
1% died.
3711 = average amount of food at end of simulation

Losses equal to gains
9% died
3941 = average amount of food at end of simulation

Gains loom larger than losses
35% died.
2205 = average amount of food at end of simulation


Now, weighing losses greater than gains really seems like the best strategy. Playing the statistician will net you 6% more food on average, but it also increases your chance of dying by 9! (The reason that the statistician ends up with more food on average is probably because the conservative losses-loom-larger-than-gains creatures don't take as many gambles and thus have less opportunity to win.)

So what does this simulation suggest? It suggests that when the stakes are high, it is better to be conservative and measure what you might win by what you might lose. If the stakes are low, this is less necessary. Given that humans tend to value losses higher than gains, this suggests that we evolved mainly to think about risks with high stakes.

Of course, that's all according to what is a very, very rough simulation. I'm sure there are better ones in the literature, but it was useful to play around with the parameters myself.

Getting a Ph.D. in psychology

Some may have noticed that my posts have been infrequent for the last week or two and wondered why. There is a simple answer to this:

Quals.

What are quals? They seem to be different in different universities, and quite possibly even between different departments. The top Google hit for "qualifying exam" sounds absolutely nothing like what I am doing. This seems to be true of graduate school in general, which is to say that there policies differ a great deal. I certainly got into trouble as a prospective graduate student by assuming that information I learned about one graduate program would generalize to another. 

One purpose of this blog is to make more information about the process available. So, for those who are interested:

As far as I can tell, the traditional qualifying exam is an examination that qualifies one to work on a Ph.D. That certainly seems to be the case in Piled Higher and Deeper, which is set at Stanford (see the comic below). 

In my department, it works very differently. Our qualifying exams are rolled into a course we take during our first year (usually). This before we get our Master's degree, which is typically at the end of the second year. 

The course is different depending on which research group you belong to. My research group (developmental) actually requires students to take our own qualifying course as well as another. I took the developmental course last semester and am taking the cognition, brain and behavior course this semester.

What is required for the courses can vary a great deal depending on which professor is in charge. This semester, we have a total of 63 hours of examination spread out over 6 tests -- three in the middle of the semester, and three this week. Which is why I have not been posting much.


Smile, you are in the newspaper

I have written about Havard happiness professor Dan Gilbert before. He was recently interviewed by the New York Times. The article is worth the read.